- Small sample size
n=150
- Session information
susieR summary statistics problem 2
Yuxin Zou
11/3/2018
Last updated: 2018-11-03
workflowr checks: (Click a bullet for more information)-
✔ R Markdown file: up-to-date
Great! Since the R Markdown file has been committed to the Git repository, you know the exact version of the code that produced these results.
-
✔ Environment: empty
Great job! The global environment was empty. Objects defined in the global environment can affect the analysis in your R Markdown file in unknown ways. For reproduciblity it’s best to always run the code in an empty environment.
-
✔ Seed:
set.seed(20180529)The command
set.seed(20180529)was run prior to running the code in the R Markdown file. Setting a seed ensures that any results that rely on randomness, e.g. subsampling or permutations, are reproducible. -
✔ Session information: recorded
Great job! Recording the operating system, R version, and package versions is critical for reproducibility.
-
✔ Repository version: 891becf
Great! You are using Git for version control. Tracking code development and connecting the code version to the results is critical for reproducibility. The version displayed above was the version of the Git repository at the time these results were generated.
Note that you need to be careful to ensure that all relevant files for the analysis have been committed to Git prior to generating the results (you can usewflow_publishorwflow_git_commit). workflowr only checks the R Markdown file, but you know if there are other scripts or data files that it depends on. Below is the status of the Git repository when the results were generated:
Note that any generated files, e.g. HTML, png, CSS, etc., are not included in this status report because it is ok for generated content to have uncommitted changes.Ignored files: Ignored: .Rhistory Ignored: .Rproj.user/ Ignored: analysis/.Rhistory Ignored: docs/.DS_Store Ignored: docs/figure/Test.Rmd/ Untracked files: Untracked: analysis/MASHbaselineCode.Rmd Untracked: analysis/mashMean.Rmd Unstaged changes: Modified: analysis/mashrEMlk.Rmd Modified: analysis/susieProblem.Rmd
Expand here to see past versions:
We show the problem using simulated data N3finemapping in susieR package.
We fit the susie model using sample size n = 150. The t statistics derived from z scores with sample size 150 are similar to the true t statistics (n = 574), but the susie results are different.
library(susieR)
data(N3finemapping)
attach(N3finemapping)
b <- data$true_coef[,1]
plot(b, pch=16, ylab='effect size', main='true effect size')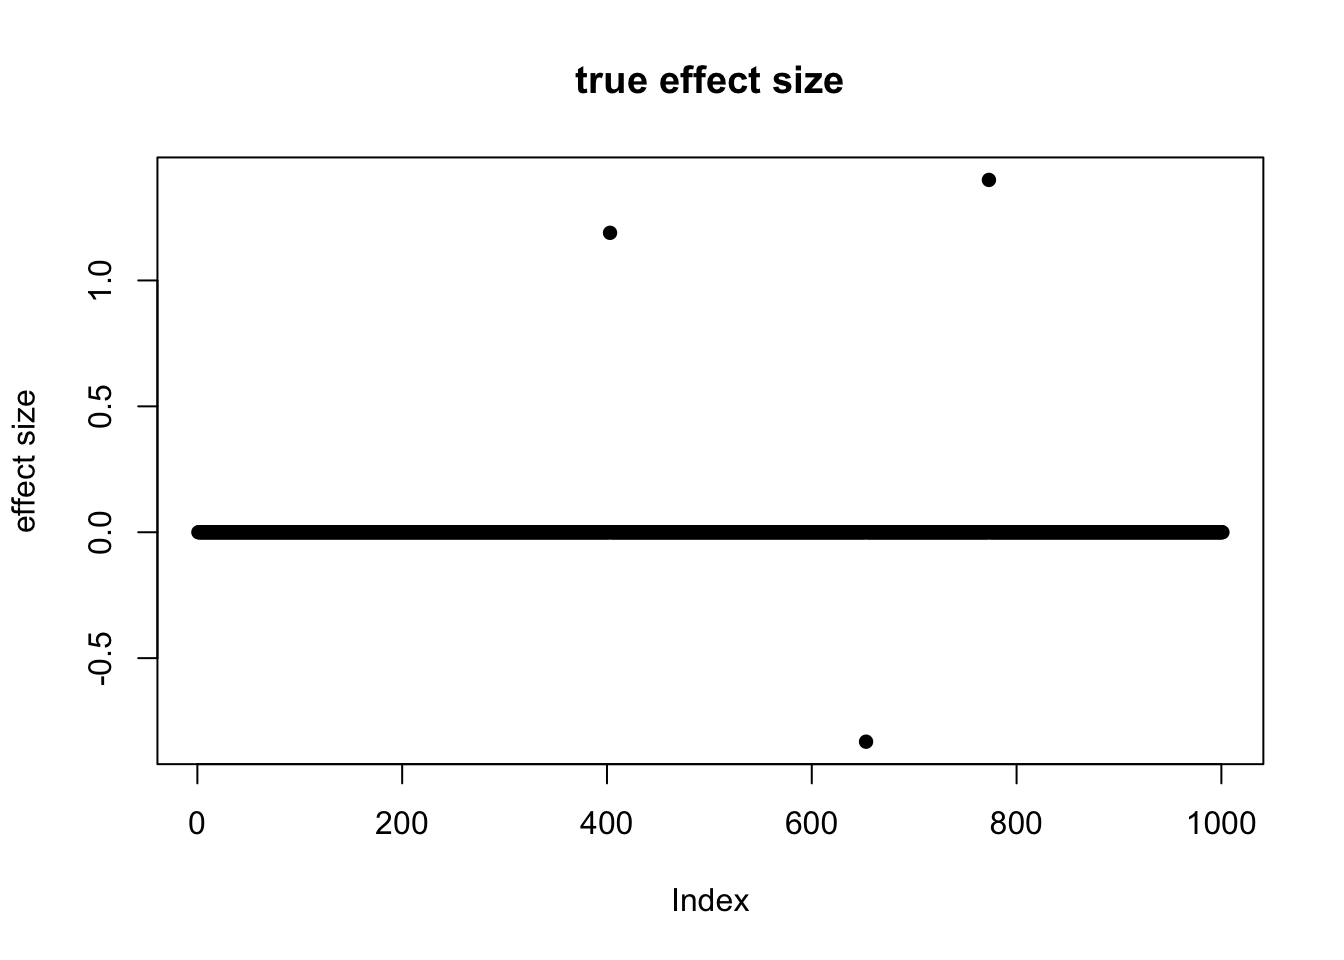
Expand here to see past versions of unnamed-chunk-1-1.png:
| Version | Author | Date |
|---|---|---|
| a13e941 | zouyuxin | 2018-11-03 |
The summary statistics come from per-variable univariate simple regression. The results are ˆβ and SE(ˆβ) from which the p-values (from t-distribution) and z-scores can be derived.
t_stat = sumstats[1,,1] / sumstats[2,,1]
p_values = 2 * pt(-abs(sumstats[1,,1] / sumstats[2,,1]), df = nrow(data$X) - 2)
z_scores = abs(qnorm(p_values/2)) * sign(sumstats[1,,1])
susie_plot(z_scores, y = "z", b=b)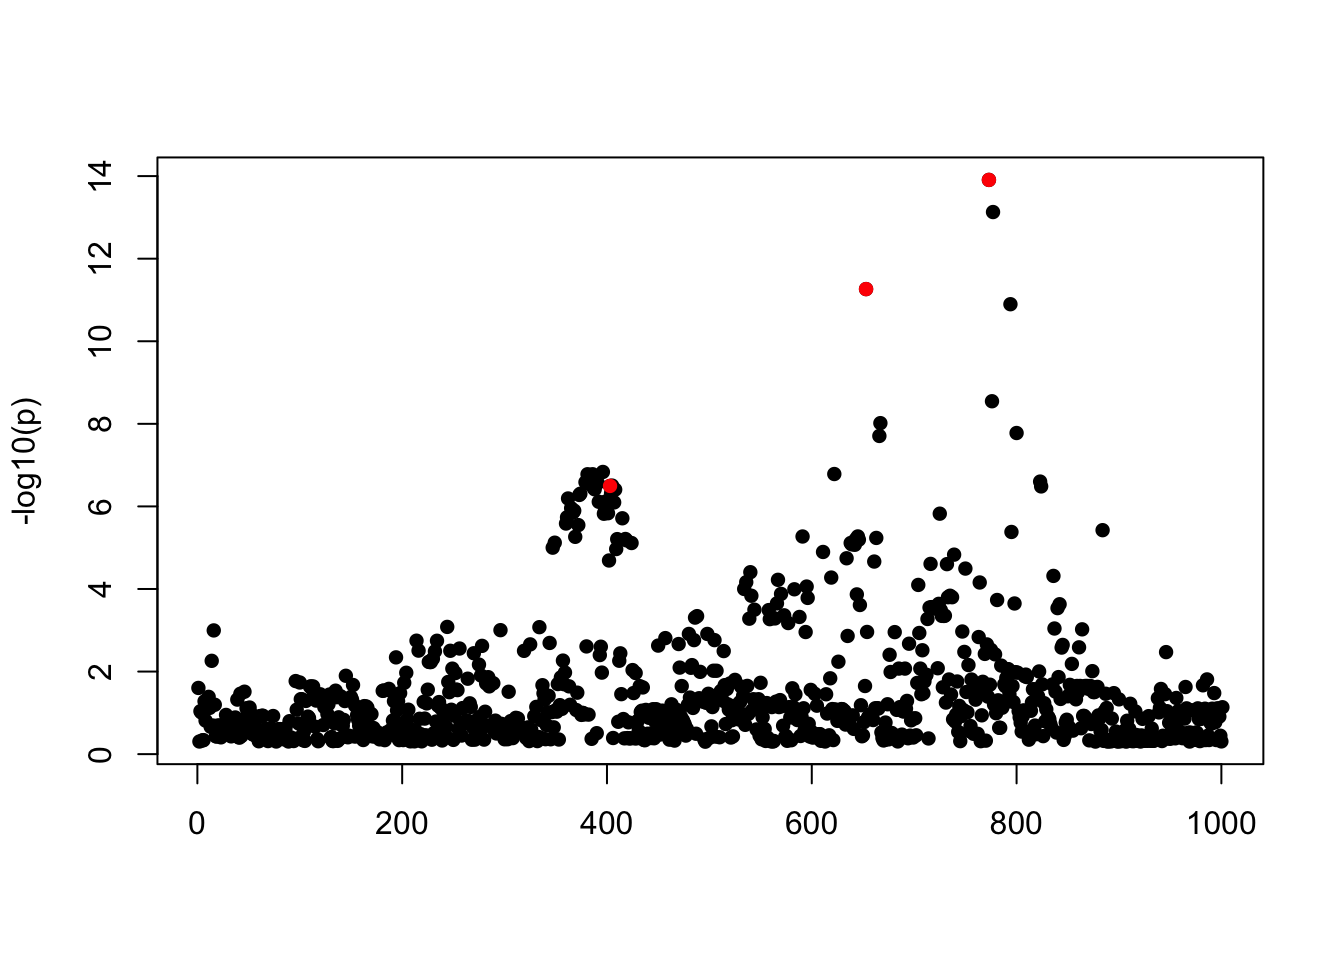
Expand here to see past versions of unnamed-chunk-2-1.png:
| Version | Author | Date |
|---|---|---|
| a13e941 | zouyuxin | 2018-11-03 |
For this example the correlation matrix can be computed directly from data provide,
R <- cor(data$X)Small sample size n=150
The model with true t statistics and sample size n=150:
fitted_t = susie_bhat(bhat = t_stat, shat = 1, R = R, n = 150, L=10,
                 scaled_prior_variance = 0.1, estimate_residual_variance = TRUE)
susie_plot(fitted_t, y='PIP', b=b, main = paste0('L = 10 elbo = ',
                                                   susie_get_objective(fitted_t)))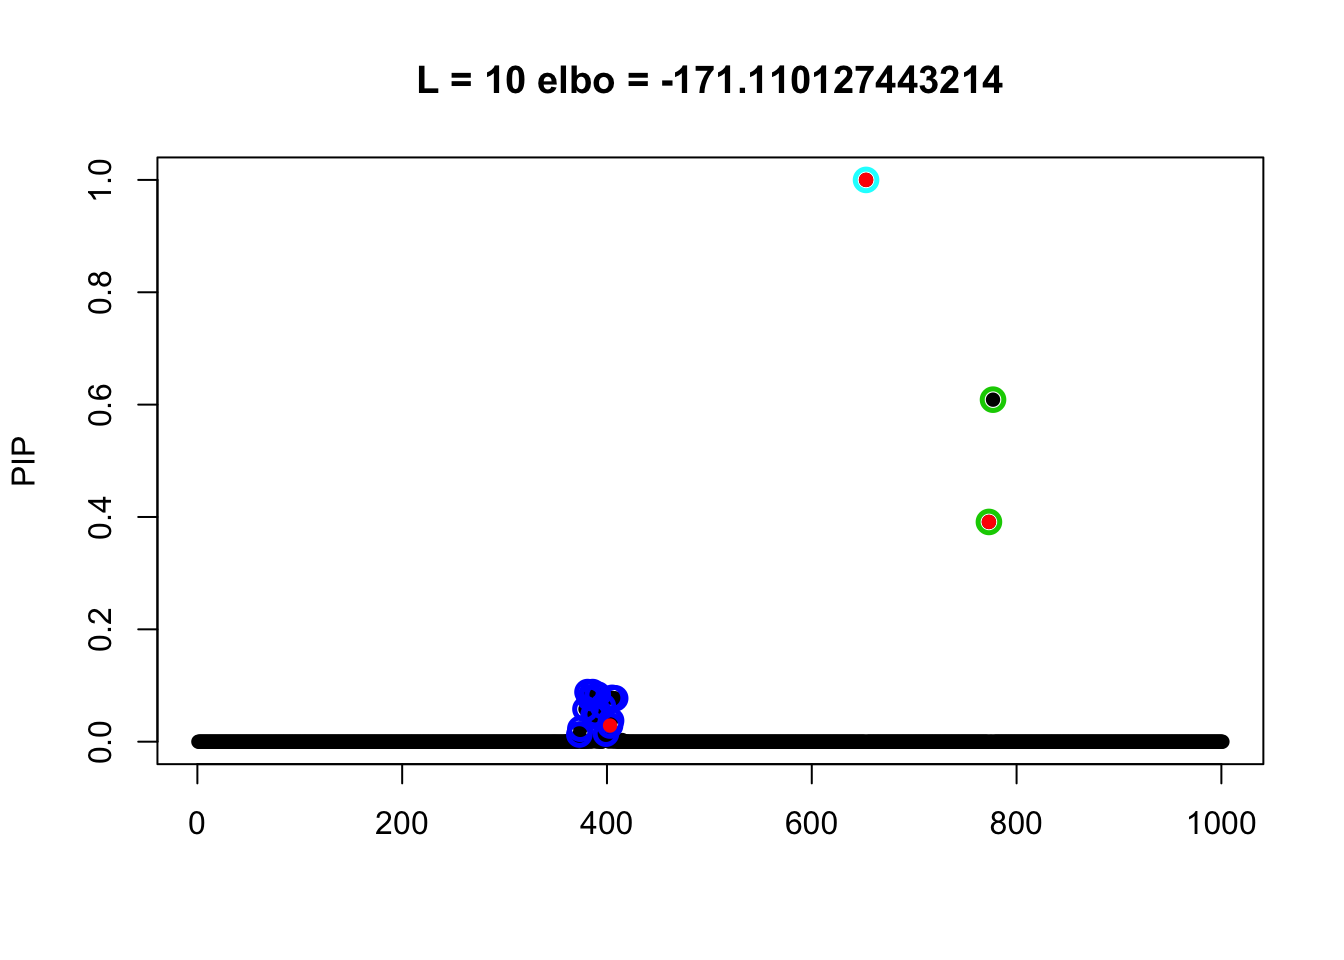
Expand here to see past versions of unnamed-chunk-4-1.png:
| Version | Author | Date |
|---|---|---|
| a13e941 | zouyuxin | 2018-11-03 |
The model with z scores (t statistics based on the n=150)
fitted_z = susie_z(z = z_scores, R = R, n = 150, L=10,
                 scaled_prior_variance = 0.1, estimate_residual_variance = TRUE)
susie_plot(fitted_z, y='PIP', b=b, main = paste0('L = 10 elbo = ',
                                                   susie_get_objective(fitted_z)))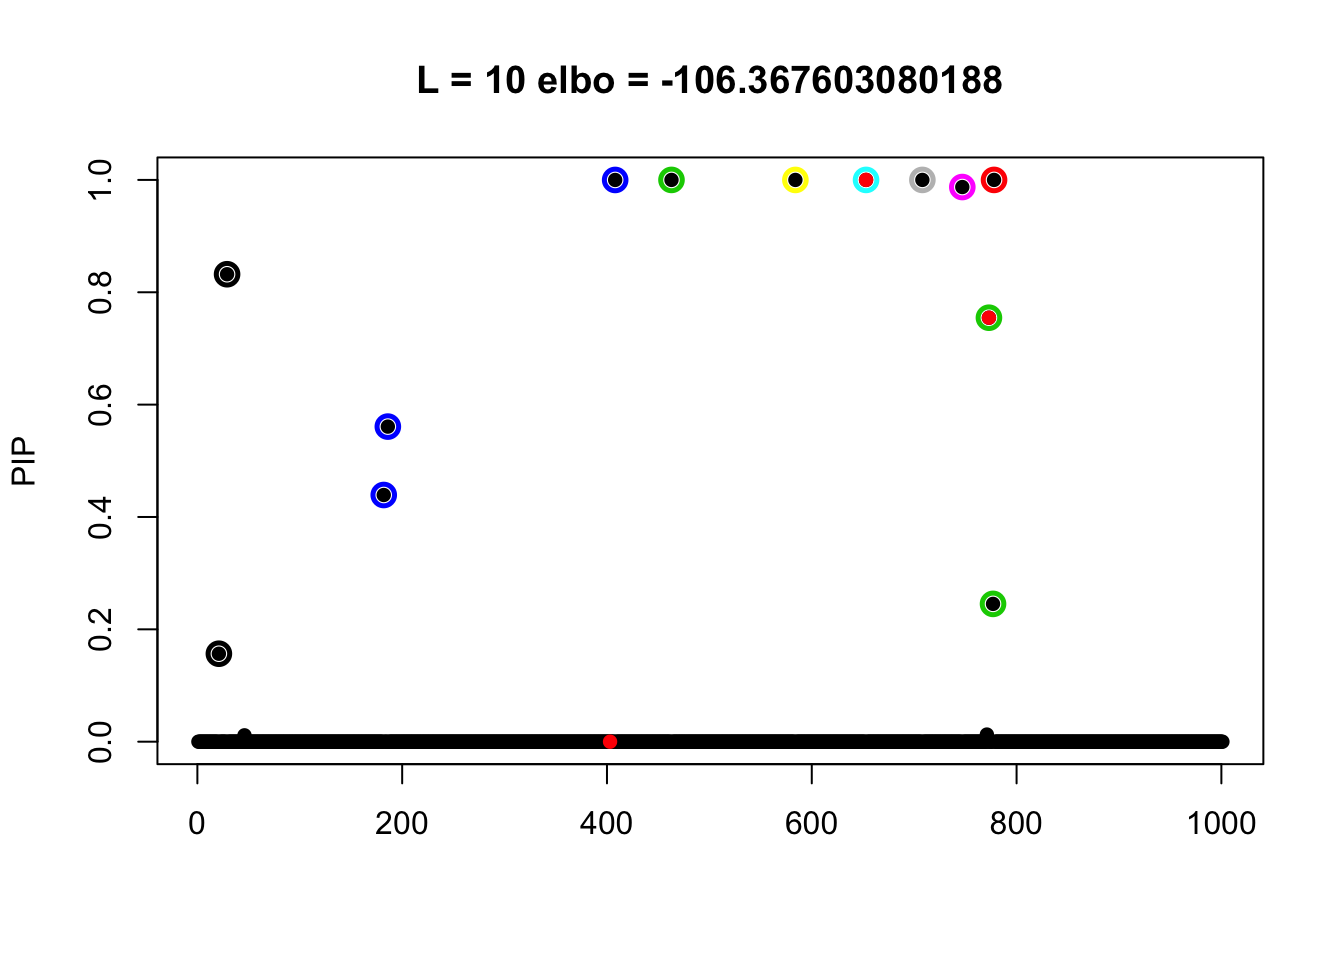
Expand here to see past versions of unnamed-chunk-5-1.png:
| Version | Author | Date |
|---|---|---|
| a13e941 | zouyuxin | 2018-11-03 |
The susie_z function converts the z scores to t statistics based on the provided sample size, n=150. We compute the t statistics from z scores with n = 150
n = 150
new_t = qt(pnorm(-abs(z_scores)), df = n-2) # all negative
new_t[which(z_scores > 0)] = -1 * new_t[which(z_scores > 0)]
The new_t and t_stat align roughly but the results are different.
mean(abs(new_t - t_stat))[1] 0.01987562boxplot(cbind(z_scores, t_stat, new_t))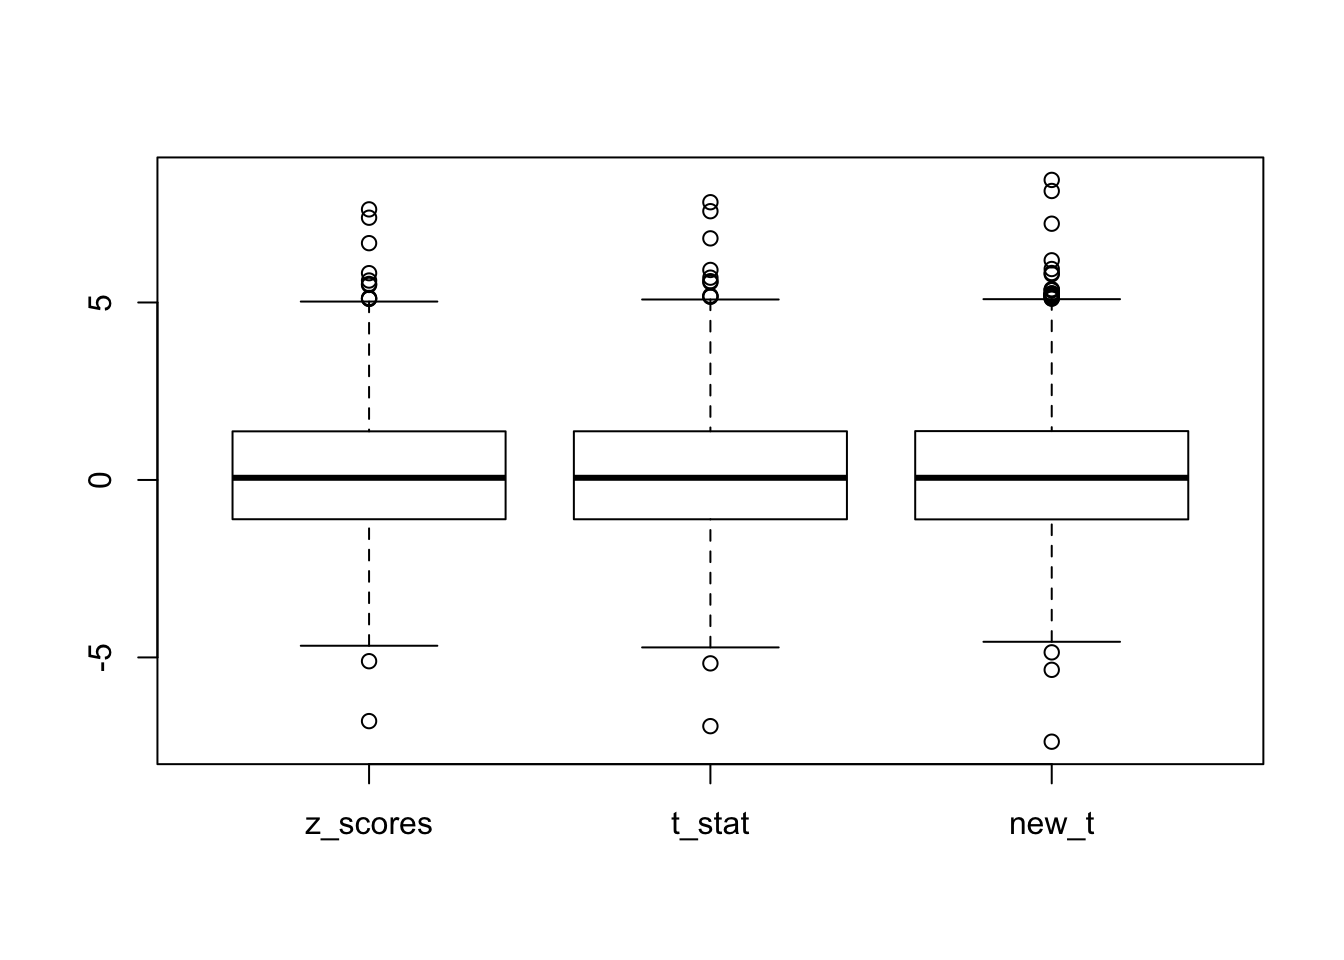
Expand here to see past versions of unnamed-chunk-8-1.png:
| Version | Author | Date |
|---|---|---|
| a13e941 | zouyuxin | 2018-11-03 |
Session information
sessionInfo()R version 3.5.1 (2018-07-02)
Platform: x86_64-apple-darwin15.6.0 (64-bit)
Running under: macOS 10.14
Matrix products: default
BLAS: /Library/Frameworks/R.framework/Versions/3.5/Resources/lib/libRblas.0.dylib
LAPACK: /Library/Frameworks/R.framework/Versions/3.5/Resources/lib/libRlapack.dylib
locale:
[1] en_US.UTF-8/en_US.UTF-8/en_US.UTF-8/C/en_US.UTF-8/en_US.UTF-8
attached base packages:
[1] stats graphics grDevices utils datasets methods base
other attached packages:
[1] susieR_0.6.1.0385
loaded via a namespace (and not attached):
[1] workflowr_1.1.1 Rcpp_0.12.19 lattice_0.20-35
[4] digest_0.6.18 rprojroot_1.3-2 R.methodsS3_1.7.1
[7] grid_3.5.1 backports_1.1.2 magrittr_1.5
[10] git2r_0.23.0 evaluate_0.12 stringi_1.2.4
[13] whisker_0.3-2 R.oo_1.22.0 R.utils_2.7.0
[16] Matrix_1.2-14 rmarkdown_1.10 tools_3.5.1
[19] stringr_1.3.1 yaml_2.2.0 compiler_3.5.1
[22] htmltools_0.3.6 knitr_1.20 expm_0.999-3 This reproducible R Markdown analysis was created with workflowr 1.1.1